Our track record
Yield certainty
Faster post-construction yield assessment
The Challenge
Post-construction assessments based on SCADA data are routinely performed on operating wind farms to:
Provide a more accurate and precise estimate of the wind farm net P50 than its respective pre-construction assessment.
Inform the accuracy of pre-construction assessments based on meteorological data, through targeted deep dive assessments.
Uncover operational issues which may otherwise remain unnoticed.
It is currently advised within the industry to gather two years of operational lifetime prior to performing a post-construction assessment. This is considered necessary so the operational period wind conditions reflects the expected long-term conditions, as no wind direction correction step is performed in standard long-term correlation processes.
The Anemona Solution: Post-construction yield assessment
To circumvent this wind distribution representativeness constraint, we developed a hybrid approach to the post-construction assessment workflow by incorporating a wind direction correction step stemming from pre-construction assessment outputs.
This wind direction step component consists in the application of power correction factors (on a wind speed and wind direction basis) based on Patterns of Production (PoP) estimated by turbine-interaction models.
To assess the impact of this correction, we estimated the post-construction yield with and without the PoP correction step on several offshore wind farms.
The Results
On all projects, the correlation between the Hindcast Power (e.g. the hindcast wind speed passed through a power curve) and the Idealised Power (e.g. the estimate that the wind farm would produce should all wind turbines be 100% available) is improved by using a wind farm power curve compared to a wind turbine power curve.
The adjustment of the estimated long-term gross P50 (e.g. gross P50 inclusive of all losses inherent to the SCADA data such as turbine-interaction losses, sub-optimal performance, inner and outer-range underperformance) due to the application of the PoP method is observed to be at its highest when the initial correlation factor is the lower.
The Outcome
Using pre-construction turbine-interaction outputs as part of a post-construction assessment lowers the uncertainty of the modelling and lowers the amount of operational SCADA data needed to yield a representative estimate.
Metric
The result
Speed to PCYA
From 2 years to 1 year
Yield accuracy improvement
ca. 0.5%

Wake loss reduction through realistic turbine availability
The Challenge
Standard wake assessments assume 100% turbine availability for both the target project and its neighbours. This idealised baseline fails to account for the physical reality of Operation & Maintenance (O&M) schedules. Because downtime reduces the cumulative wake effect within an array, standard models systematically over-estimate losses. This conservative bias leads to under-reported Annual Energy Production (AEP) and an unnecessarily diluted business case.
The Anemona Solution: Pre-construction yield assessment
We replaced static availability assumptions with a stochastic Monte Carlo framework. Instead of assuming every rotor is spinning, we simulate the wind farm as a probabilistic system where turbines intermittently go offline for maintenance or repairs. This can also be done with a time-series approach.
Simulating Reality: Our framework evaluates thousands of turbine-state iterations based on realistic downtime probability distributions, rather than a single "best case" scenario.
Dynamic Interaction: We re-calculate the aggregate wake loss for every simulated state, quantifying the exact energy "recovery" that occurs when upstream turbines are not extracting momentum from the flow.
Realism in Modelling: By integrating real-world O&M profiles into the yield assessment, we move from conservative guesswork to a high-fidelity reflection of asset performance.
The Results
By accounting for the reality of turbine downtime, we identified a consistent recovery of energy that standard industry models ignore.
The Outcome
Anemona provides the technical rigour to identify hidden value in complex wind farm physics. By correcting wake loss estimates to reflect operational reality, we improve the project business case and ensure our clients bid with the most accurate financial data available.
Metric
The result
Wake loss accuracy
Absolute reduction of 0.12% – 0.15%
AEP reporting
Direct uplift in net energy yield
Model fidelity
100% alignment with realistic O&M availability
Advanced mesoscale flow modelling
The Challenge
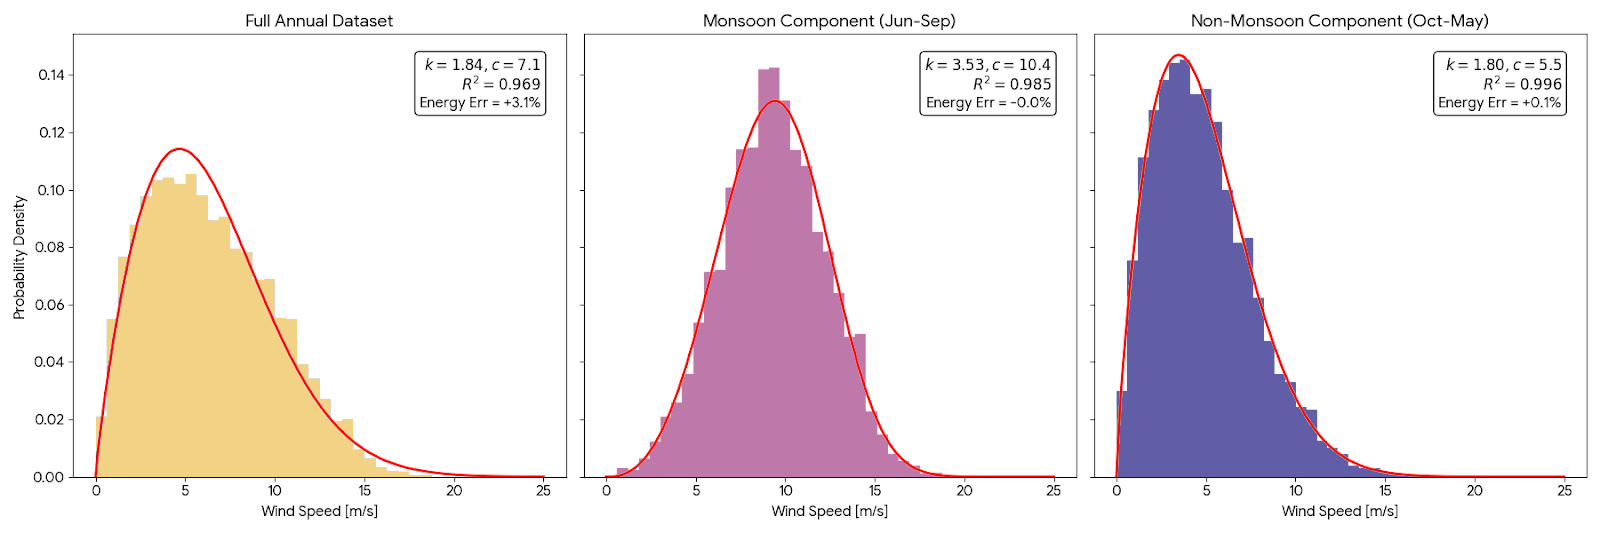
Wind resource methodologies are often tailored to Northern European conditions. Standard assumptions, such as fitting distributions to a single Weibull curve, fail in regions with bimodal wind regimes. Additionally, standard Wind Resource Grids (WRGs) frequently rely on "representative years" (arbitrary daily selections) to estimate long-term climate. While computationally efficient, this approach may fail to properly capture spatial inhomogeneity and leads to errors when speed-ups are calculated using Weibull ratios.
The Anemona Solution: Pre-construction yield assessment
We developed a tool utilising full 20-year mesoscale time series to estimate Weibull parameters from high-fidelity datasets. For bimodal sites, the tool can produce segmented WRGs, by season, month, or hour, ensuring that subsets are more tightly fitted to Weibull distributions for precise modelling and circumventing the limitations of standard WRGs.
The Results
Flow modelling accuracy for nearshore sites improved as underlying datasets were more representative of long-term conditions than standard products. The tool significantly reduced horizontal extrapolation errors in bimodal regions by ensuring wind distribution subsets were accurately modelled.
The Outcome
We established an internal tool that improves upon industry-standard accuracy for nearshore projects and regions with complex, bimodal wind distributions.
Metric
The result
Wind speed-ups accuracy
Higher than with standard approaches
Flow modelling uncertainty
Lower risk, lower forecasting error
Site-specific power curve loss quantification
The Challenge
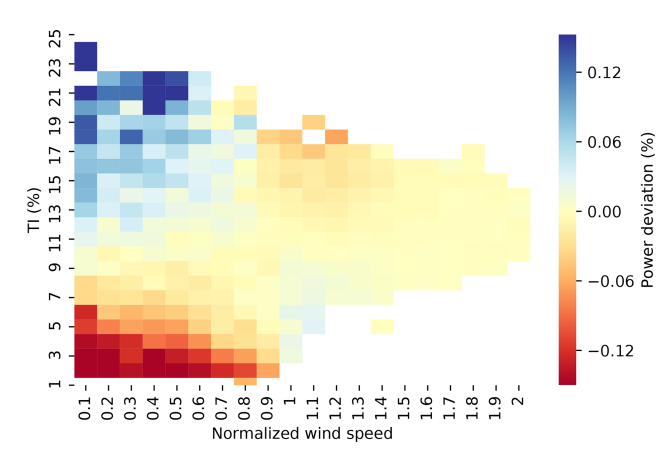
Wind Turbine Generator (WTG) power curves are warranted only when environmental parameters (such as turbulence intensity and wind shear) are within specific ranges (Inner Range - IR). Performance in Outer Range conditions (OR) is not warranted and often results in underperformance.
Past industry initiatives, such as Power Deviation Matrices (PDMs), rely on outdated onshore data and fixed ranges that fail to reflect modern offshore turbine performance or project-specific warranties. Consequently, bankable yield assessments often ignore these losses or rely on high-level heuristics.
The Anemona Solution: Pre-construction yield assessment
We developed a methodology utilising aeroelastic tools and representative turbine models to simulate performance across the full spectrum of site-specific conditions. This allows for a direct comparison of energy capture under varying turbulence and shear profiles at the same mean wind speeds, ensuring the model is representative of future WTG technology.
The Outcome
This approach provides realistic, project-specific power curve loss estimates. By replacing generic heuristics with high-fidelity aeroelastic modelling, we ensure yield assessments accurately reflect the technical reality and warranty conditions of the asset.
Metric
The result
Site-specific underperformance uncertainty
Lower compared to PDMs
AEP adjustment
ca. +/- 0.5%
Integrated system optimisation
De-Risking North Sea wind farm through Holistic Optimisation
The Challenge
In a major German North Sea project of a major offshore wind player, the development team was trapped in a 10-month design loop. They relied mostly on "black box" legacy code and disconnected Excel models. This manual hand-off between departments slowed things down and it created engineering silos that made true optimisation impossible. The result was a "safe" design that left significant value on the table.
The Anemona Solution: Integrated Optimisation
We replaced these manual processes with a Holistic Optimisation framework. Instead of passing spreadsheets back and forth, we integrated the expertise of every discipline into an automated workflow. This allowed us to treat the entire wind farm as a single, dynamic system.
Exploration at Scale: Our automated workflow evaluated thousands of permutations in the design space, simultaneously balancing trade-offs between competing disciplines.
Transparent Decision Making: We moved away from static reports to interactive dashboards, allowing stakeholders to see the financial impact of technical trade-offs.
Precision over Guesswork: By integrating all disciplines directly into the design phase, we identified efficiencies that manual methods simply could not detect.
The Results
In just six weeks, we identified the optimal combination of installed capacity, wind turbine size, layout, O&M strategy and electrical array cable ratings, that outperformed the 10-month baseline across every key metric.
The Outcome
Anemona delivers competitive system designs by replacing legacy processes with high-fidelity automation. We provide the technical infrastructure required to reduce LCOE and accelerate the transition from site selection to Final Investment Decision (FID).
Metric
The result
Speed to design
85% faster (6 weeks vs 10 months)
LCOE impact
1.6% reduction
Project NPV
€40M increase over the asset lifetime
Financial yield
+35 bps IRR absolute improvement

Footprint optimisation and wake compensation trade-off analysis
The Challenge
A UK offshore extension project positioned upstream of an existing asset was contractually liable for external wake losses. The design team faced a critical technical conflict: increasing the buffer distance reduces expensive compensation payments but constrains the available footprint for the project, thereby increasing internal wake losses and reducing own-project yield. Standard manual iteration could not effectively resolve the trade-off between external liabilities and internal asset performance to find the true commercial optimum.
The Anemona Solution: Integrated optimisation
We deployed a Python-driven workflow to automate the footprint analysis and identify the mathematical optimum. We integrated validated wake models with financial revenue projections to evaluate the net profit of every potential configuration.
Automated Scenario Generation: Our algorithms evaluated thousands of layout strategies and variations in electricity prices, adjusting buffer distances, shapes and turbine layouts simultaneously.
Dynamic Liability Modelling: We calculated compensation requirements based on projected electricity prices and contractually defined MWh loss-rates for the downstream wind farm.
Systemic Profit Optimisation: The workflow identified the specific spatial configuration that maximised net profit by accounting for the total financial interaction between internal yield and external compensation.
The Results
Our solution found the optimal buffer and layout that maximised revenues for the extension project. We delivered in a few days what an analyst could manually do using commercial off-the-shelf software in weeks.
The Outcome
Anemona replaces manual guesswork with automated search logic and bespoke layout algorithms. We provide the technical clarity required to navigate complex constraints under uncertain market conditions, ensuring that developers do not leave value untapped due to conservative or siloed design choices.
Metric
The result
Analysis velocity
Weeks of manual work collapsed into days
Scenario depth
Thousands of permutations evaluated vs. a handful of manual iterations
Technical resolution
Meter-perfect buffer optimisation

Unified wind farm layout to delay turbine selection
The Challenge
A major offshore development team faced a critical scheduling conflict. To maintain the project milestone for geophysical soil studies, an expensive and time-sensitive drilling campaign, the turbine layout had to be finalised. However, the turbine model selection was a strategic procurement decision scheduled for much later in the project lifecycle. Since the turbine capacity dictates the total number of locations required to meet the fixed installed capacity, the team was trapped in a dilemma: delay the drilling at a high cost, or commit to a turbine model prematurely.
The Anemona Solution: Integrated optimisation
We proposed and optimised a turbine-agnostic layout designed to accommodate the maximum number of potential locations (corresponding to the smaller turbine option). This created a "master layout" from which positions could be strategically removed if the larger turbine model was eventually selected.
Sub-set Optimisation: We utilised automated search logic to ensure that the layout for the larger turbine, while a subset of the master layout, remained mathematically performant.
Sensitivity Analysis: We quantified the performance trade-offs of this agnostic approach, providing the engineering team with the data required to justify the decision to the board.
Logistical De-risking: By fixing the maximum possible locations early, we enabled the geophysical campaign to proceed without risk of rework or misplaced boreholes.
The Results
The agnostic approach allowed the project to proceed with its multi-million euro drilling campaign while maintaining full procurement flexibility.
The Outcome
Anemona resolves complex design frictions by applying smart, non-linear engineering logic. By proving that the loss in optimality was negligible, we provided a pathway for the project to meet critical development milestones without sacrificing long-term profitability or procurement strategy.
Metric
The result
Wake loss impact
<0.1% delta compared to a turbine-specific optimum
Project schedule
Zero delay to geophysical survey milestones
Procurement risk
100% flexibility in turbine model selection
Financial security
Elimination of the risk of redundant or misplaced boreholes

LCOE-driven wind farm layout optimisation
The Challenge
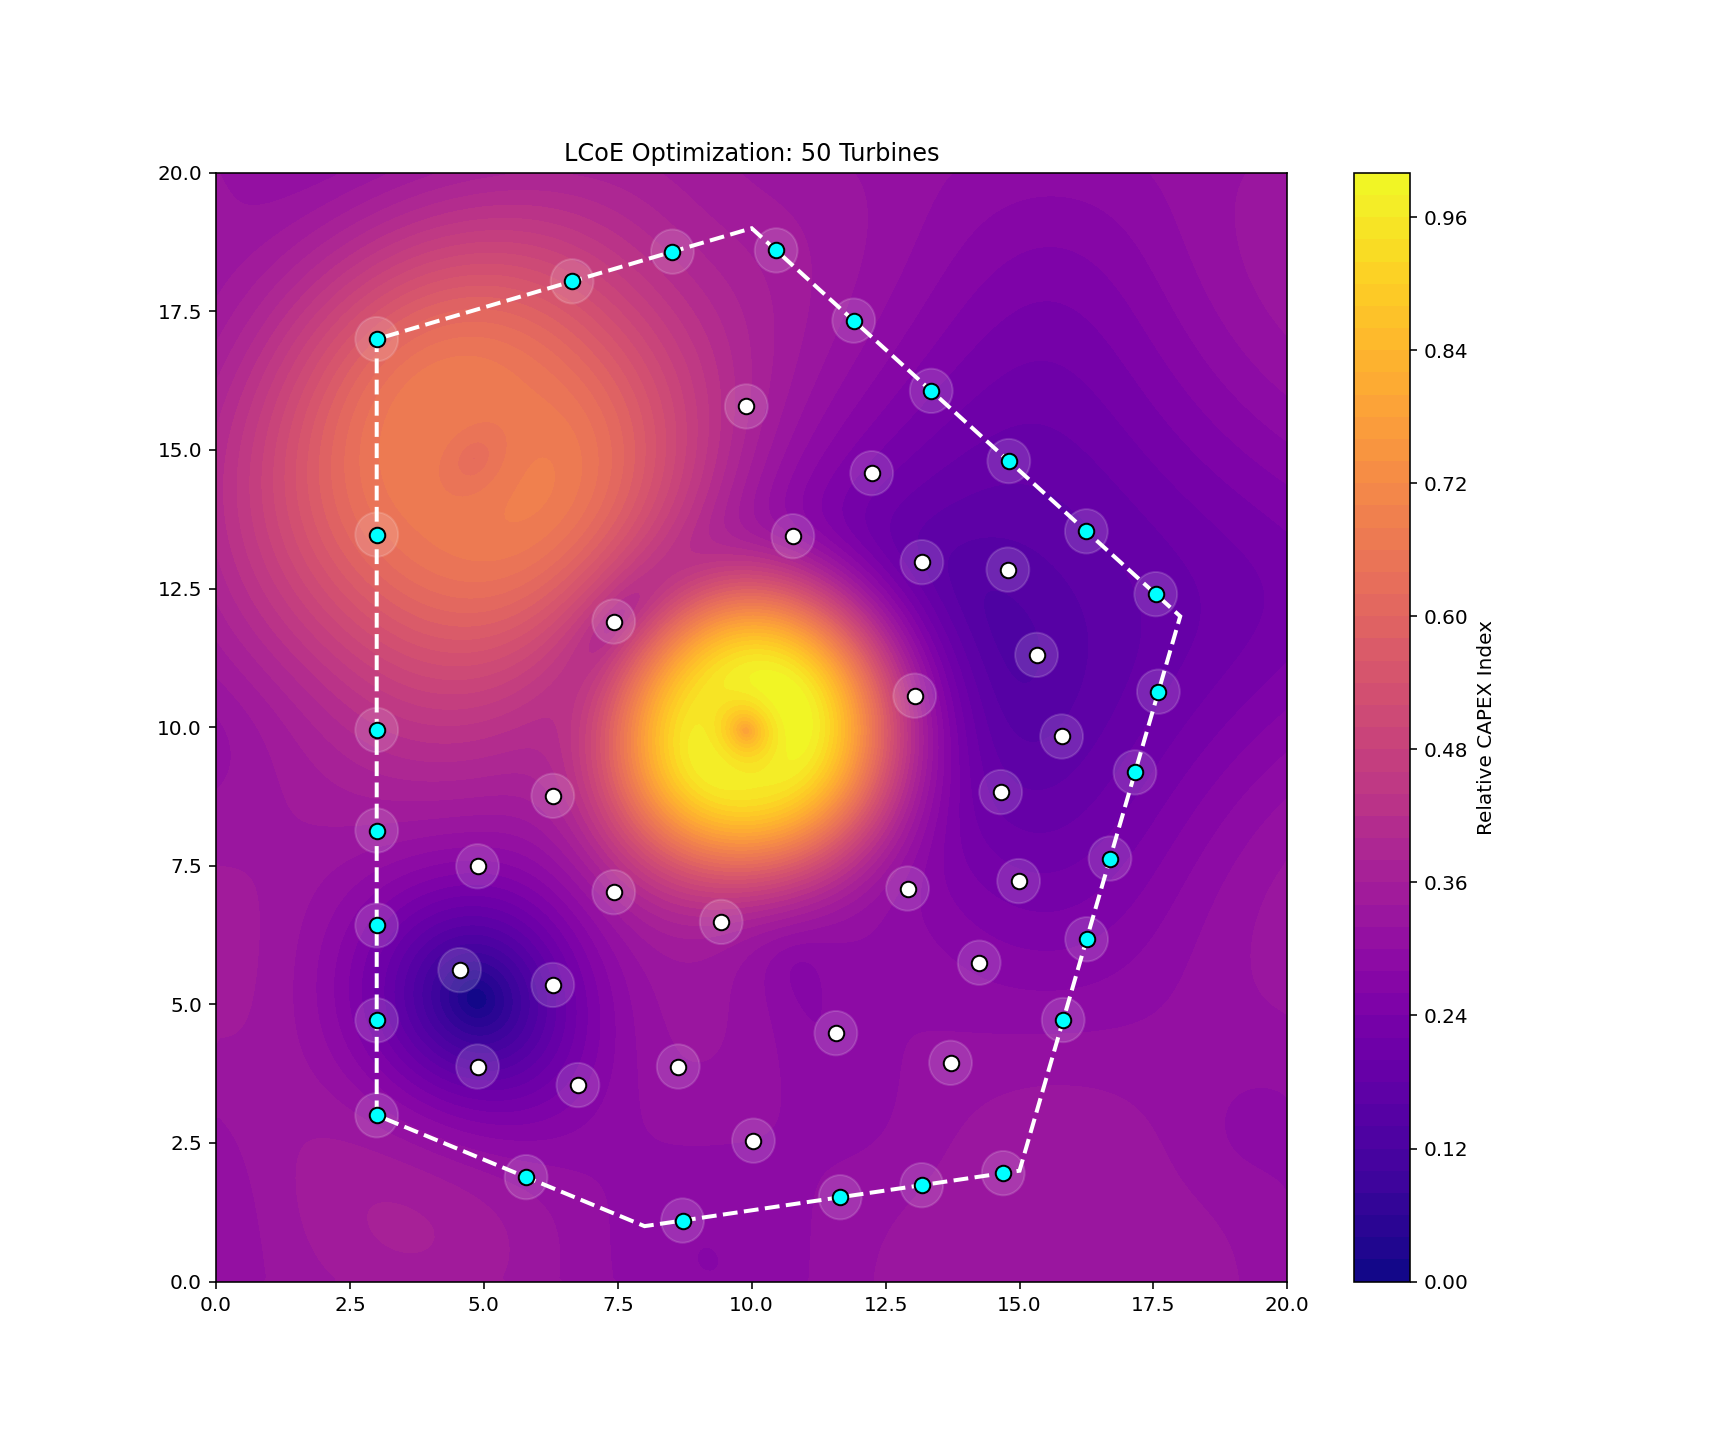
During development for a major offshore wind player, the layout required optimisation across a site with highly variable bathymetry and soil characteristics. Consequently, jacket height and installation costs fluctuated by turbine location. Optimising for Annual Energy Production (AEP) was no longer equivalent to optimising for Levelised Cost of Electricity (LCoE). The design process had to incorporate construction cost variations alongside yield.
The Anemona Solution: Integrated optimisation
To minimise project LCOE, we coordinated with foundation, installation, and electrical engineering functions to map variable costs across the zone. Utilising a financial equation linking LCOE, AEP, and CAPEX, we developed a Python-based framework to optimise the project for LCOE rather than AEP.
The Results
Introducing LCOE as the primary KPI enabled the team to evaluate layouts for both yield and cost, increasing design robustness. Optimising for LCOE outperformed AEP-optimised layouts by €0.5/MWh which translates to an NPV increase of 27 M€.
The Outcome
Anemona evolved an AEP-driven algorithm into a LCOE-driven optimisation, integrating all relevant functions into the design loop. This resulted in layouts specifically fit for purpose under Contracts for Difference (CfD) schemes.
Metric
The result
LCoE reduction
-€0.5/MWh
NPV increase
27 M€
Design robustness
Increased through multi-objective evaluation
Workflow modernisation
T&I Programme Optimisation
The Challenge
Transport and Installation (T&I) planning for offshore assets is typically a bottleneck. Traditional methods rely on static schedules and generic weather downtime factors. This manual approach limits the project team to evaluating only a handful of scenarios, often leading to suboptimal vessel selection and inflexible start dates. For a big renewables project, this lack of visibility translates directly into Capex inflation.
The Anemona Solution: Workflow modernisation
Anemona replaced static planning with an automated simulation environment. We integrated Metocean data, vessel specifications, and scheduling logic into a single workflow. This allowed for the systematic evaluation of millions of T&I programme permutations.
Variable Exploration: We simulated the impact of different vessel counts, sizes, and combinations on the total programme duration.
Weather-Dynamic Scheduling: Instead of using fixed downtime percentages, we used historical Metocean data to test the feasibility of thousands of start dates and schedule floats.
Cost-Benefit Transparency: We mapped every logistical scenario to its specific cost profile, allowing decision-makers to see the exact trade-off between schedule speed and financial risk.
The Results
By exploring the full logistical design space, we identified a high-probability installation strategy that significantly outperformed the manual baseline.
The Outcome
Logistical efficiency is found in the permutations that manual workflows cannot reach. Anemona provides the computational tools to identify the lowest-cost, lowest-risk installation path, ensuring that the T&I programme is a source of value rather than a source of contingency.
Metric
The result
Direct cost savings
€35 Million
Scenario exploration
Millions of schedules vs. a dozen manual cases
Risk management
Quantified feasibility based on site-specific Metocean data
Financial yield
+35 bps IRR absolute improvement
Site capacity characterisation for greenfield leasing
The Challenge
During a competitive leasing round involving over 10 greenfield sites, a development team was tasked with defining the maximum installed capacity for each area.
To build a robust commercial bid, they required the absolute physical limits for each site, accounting for shifting technical variables: varying turbine rotor diameters, rotor specific powers, and the minimum inter-turbine spacing required for load mitigation.
The sites featured highly irregular geometries due to complex soil constraints and exclusion zones.
Manual layout design and standard commercial off-the-shelf software could not mathematically guarantee the true maximum capacity within the compressed timelines of the bid process.
The Anemona Solution: Workflow modernisation
We deployed a Python-based optimisation framework to resolve the turbine packing problem for each site. The algorithm was specifically designed to find the absolute maximum number of locations while strictly adhering to buildable area limits and spacing requirements.
Exhaustive Iteration: We systematically iterated over every possible turbine configuration, providing the financial team with the absolute capacity ceiling for each scenario rather than an estimated average.
Geometric Packing Resolution: Our framework handled irregular boundaries and soil-related exclusion zones with a level of precision that manual workflows cannot replicate.
Strategic Ceiling Definition: By identifying the mathematical maximum for each site, we provided the definitive data required for the financial team to evaluate the ultimate commercial viability and bidding strategy for each lease.
The Results
The automated search identified the absolute physical and commercial limits of all 10+ sites in a few days, a task that typically requires weeks of manual iteration.
The Outcome
Anemona replaces the limitations of manual layout design with high-fidelity algorithmic search. By delivering the precise maximum capacity limits across a vast design space, we enabled the development team to submit bids based on mathematical certainty. We provided the technical infrastructure required to move from site selection to a competitive bid with absolute confidence in the asset's maximum potential.
Metric
The result
Analysis velocity
Days instead of weeks
Scale of evaluation
10+ distinct greenfield sites processed simultaneously
Data fidelity
100% iteration across all WTG size and spacing permutations